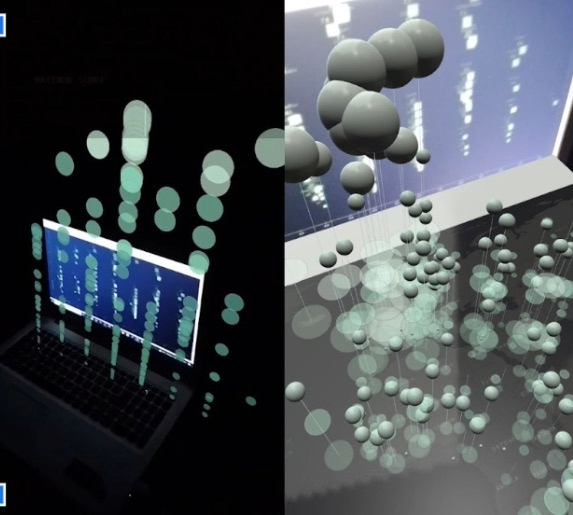
Data visualization is an effective way to understand complex information, and when combined with augmented reality it allows users to see data in a more interactive and intuitive way, making it easier to understand complex data sets. Using data visualization and AR to present corruption-related datasets; Users can interact with data by using gestures or other intuitive methods making it easier to identify patterns, trends, relationships and anomalies.
Data has long stopped being structured and flat, but the results of our analysis are still rendered as flat bar charts and scatter plots. We live in a 3D world, and we need to be able to enable data interaction from all perspectives.Data visualization with AR / immersive analytics has the potential to transform the way we view and interact with data. AR visualizations provide a more engaging, intuitive and immersive experience that makes it easier to understand datasets even for non-experts & quickly identify patterns leading to better decision-making processes and outcomes.

